Monitoring and Logging
Monitoring and Logging for Full-Stack Applications
Imagine you’re running a blogging application where users read posts, filter them by tags or dates, and admins manage content. Everything seems fine—until the site slows down, users complain about errors, or it crashes entirely. How do you know what went wrong? Or better yet, how do you catch issues before users notice? This is where monitoring and logging come in. They’re like the dashboard and logbook of your application, helping you track performance, spot errors, and keep your app running smoothly.
Monitoring and logging are critical for:
- Uptime: Ensuring your app is always available.
- Performance: Making sure pages load quickly and filters work seamlessly.
- Debugging: Finding and fixing errors, like why a post didn’t save.
- Security: Detecting suspicious activity, like repeated failed logins.
- User Experience: Understanding how users interact with your app.
Let’s consider a relatable scenario: Your blogging app suddenly gets a traffic spike because a post goes viral. The site slows to a crawl, and some users can’t load posts. Without monitoring, you’re blind to the cause—maybe the database is overwhelmed, or a buggy filter is causing delays. Without logs, you can’t retrace what happened. Monitoring and logging give you the tools to detect, diagnose, and fix issues fast.
Common Misconception: “I’ll just check the app manually if something goes wrong.” This works for a small app but fails when you have thousands of users or complex features like filtering by tags. Another misconception is that monitoring is only about uptime. In reality, it covers performance, user behavior, and even business metrics like how many posts are created daily.
Section 1: What Are Monitoring and Logging?
Monitoring
Monitoring is like having a health monitor for your app. It tracks metrics in real-time to tell you how your system is performing. Metrics might include:
- Uptime: Is the app online?
- Response Time: How long does it take to load a post?
- Error Rates: How many requests fail?
- Resource Usage: Is the CPU or memory overloaded?
For our blogging app, you might monitor:
- How fast the homepage loads.
- Whether the database query for filtering posts by tag is slow.
- If the admin panel crashes when saving a post.
Logging
Logging is like keeping a diary of everything your app does. Every action—user visits, errors, or admin updates—gets recorded with details like timestamps and context. Logs help you:
- Debug errors (e.g., why a post failed to publish).
- Track user behavior (e.g., which tags are most popular).
- Audit security (e.g., who tried to access the admin panel).
For our blogging app, logs might record:
- A user filtered posts by “tech” at 10:15 AM.
- An error occurred when saving a post due to a missing title.
- An admin logged in successfully.
Misconception Alert: Students often think logging is just for errors. Not true! Logs are also for tracking normal behavior, like how many users viewed a post, or auditing actions, like who edited a post.
Example: Monitoring and Logging in Action
Let’s say a user reports that filtering posts by “lifestyle” is slow. Monitoring shows the database query takes 5 seconds (too long!). Logs reveal the query is scanning thousands of posts without an index. With this info, you add an index to the database, and the query drops to 0.2 seconds. Monitoring confirms the fix, and logs show no more complaints.
Section 2: Use Cases for Monitoring and Logging
Monitoring and logging serve multiple purposes in a full-stack blogging app. Let’s explore them with examples.
1. Ensuring Uptime
Goal: Keep the app online 24/7.
- Monitoring: Tools like UptimeRobot or Pingdom check if your app is reachable every minute. If it’s down, you get an alert.
- Logging: Logs record when the server crashed and why (e.g., “Out of Memory at 3 AM”).
- Example: Your blogging app goes down due to a server restart. Monitoring alerts you instantly, and logs show the restart was caused by a memory leak in the image upload feature.
2. Optimizing Performance
Goal: Make the app fast and responsive.
- Monitoring: Tools like New Relic or Datadog track response times, database query speeds, and CPU usage.
- Logging: Logs show which endpoints (e.g.,
/posts?tag=tech) are slow and why. - Example: Users complain that filtering by date takes ages. Monitoring shows the query is slow, and logs reveal it’s fetching all posts before filtering. You rewrite the query to filter directly in the database, cutting load time from 4 seconds to 0.5 seconds.
3. Debugging Errors
Goal: Find and fix bugs quickly.
- Monitoring: Tracks error rates (e.g., 10% of requests to
/admin/save-postfail). - Logging: Logs detail the error (e.g., “NullPointerException: Missing post title”).
- Example: An admin can’t save a post. Monitoring shows a spike in 500 errors, and logs pinpoint the issue: the title field is optional in the UI but required in the database. You add validation to the UI to fix it.
4. Security and Auditing
Goal: Protect the app and track actions.
- Monitoring: Detects unusual activity, like 100 login attempts in a minute.
- Logging: Records who accessed what (e.g., “Admin John edited post #123”).
- Example: Logs show repeated failed login attempts to the admin panel. Monitoring alerts you to a potential brute-force attack, so you enable rate-limiting.
5. Understanding User Behavior
Goal: Improve the app based on how users interact with it.
- Monitoring: Tracks metrics like daily active users or popular filters.
- Logging: Logs user actions (e.g., “User viewed post #456 with tag ‘lifestyle’”).
- Example: Monitoring shows 80% of users filter by “lifestyle.” Logs confirm they view these posts longer. You decide to feature “lifestyle” posts on the homepage.
6. Business Metrics
Goal: Track app success.
- Monitoring: Measures how many posts are created or viewed daily.
- Logging: Logs admin actions like post creation.
- Example: Monitoring shows a drop in new posts. Logs reveal admins are struggling with the editor. You simplify the admin panel to boost content creation.
Section 3: Tools and Services for Monitoring and Logging
There are many tools to help you monitor and log your blogging app. Let’s break them down.
Monitoring Tools
- UptimeRobot: Checks if your app is online every 5 minutes. Free for basic use.
- Use Case: Alerts you if the blogging app goes down.
- New Relic: Tracks performance metrics like response times and database queries.
- Use Case: Identifies slow endpoints, like filtering posts by tag.
- Datadog: Monitors servers, databases, and user interactions.
- Use Case: Detects high CPU usage during traffic spikes.
- Prometheus + Grafana: Open-source tools for custom metrics and dashboards.
- Use Case: Visualizes how many users filter posts by date vs. tag.
- AWS Cloud Watch: Optimised for AWS Infrastructure
- Use Case: Monitor status and performance of you AWS apps and containers
- Azure Monitor: Optimised for Azure Infrastructure
Logging Tools
- Sentry: Captures errors with stack traces and context.
- Use Case: Debugs why a post failed to save.
- Loggly: Aggregates logs from your app and lets you search them.
- Use Case: Finds all logs related to “lifestyle” filter requests.
- ELK Stack (Elasticsearch, Logstash, Kibana): Open-source logging solution for advanced analysis.
- Use Case: Audits admin actions like post edits.
- Cloudwatch (AWS): Logs and monitors if your app runs on AWS.
- Use Case: Tracks server logs during a traffic spike.
Example: Setting Up Monitoring and Logging
For our blogging app, you might:
- Use UptimeRobot to check if the app is online.
- Use New Relic to monitor response times for the
/postsendpoint. - Use Sentry to catch errors when users filter posts.
- Use Loggly to log user actions like viewing or filtering posts.
Advanced Example: You set up Prometheus to track custom metrics, like the number of posts filtered by “tech” vs. “lifestyle.” You use Grafana to create a dashboard showing these metrics over time. Logs in ELK Stack show which users are filtering most often, helping you optimize the database for popular tags.
Section 4: Stress Testing for Performance and Uptime
Stress testing is like putting your app through a fitness test. It simulates heavy traffic or extreme conditions to see how your app holds up. This is critical for ensuring uptime and performance under pressure.
Why Stress Test?
- Find Limits: How many users can your app handle before it slows down?
- Prepare for Spikes: Can it survive a viral post?
- Optimize: Identify bottlenecks, like slow database queries.
How to Stress Test
- Tools:
- Locust: Simulates thousands of users hitting your app.
- JMeter: Tests specific endpoints like
/posts?tag=lifestyle. - k6: Modern tool for load testing with JavaScript.
- Process:
- Simulate normal traffic (e.g., 100 users browsing posts).
- Ramp up to peak traffic (e.g., 10,000 users filtering posts).
- Monitor CPU, memory, and response times.
- Check logs for errors during the test.
- Metrics to Watch:
- Response time: Should stay under 1 second.
- Error rate: Should be near 0%.
- Resource usage: CPU/memory shouldn’t max out.
Example: Stress Testing the Blogging App
You use Locust to simulate 5,000 users filtering posts by “lifestyle.” Monitoring shows response times climb to 10 seconds, and logs reveal the database is overloaded. You optimize the query with an index and add caching. A second test shows response times drop to 0.8 seconds, and the app handles 10,000 users without crashing.
Advanced Example: You use k6 to test the admin panel under stress. You simulate 100 admins saving posts simultaneously. Monitoring shows high CPU usage, and logs reveal a locking issue in the database. You switch to asynchronous saves, and the app now handles 500 concurrent admins.
Advantages and Disadvantages
- Advantages:
- Ensures uptime during traffic spikes.
- Improves performance by finding bottlenecks.
- Builds confidence in your app’s reliability.
- Disadvantages:
- Time-consuming to set up and analyze.
- May require expensive tools or cloud resources.
- Can miss edge cases not covered by tests.
Conclusion
Monitoring and logging are your app’s lifeline. They ensure uptime, optimize performance, debug errors, enhance security, and provide insights into user behavior. For our blogging app, monitoring catches slow filters, logs pinpoint errors, and stress testing prepares for viral posts.
Key Takeaways:
- Monitor uptime, performance, errors, and user behavior with tools like New Relic or Prometheus.
- Log everything—errors, user actions, and admin changes—with tools like Sentry or Loggly.
- Stress test with Locust or k6 to find and fix bottlenecks.
- Combine monitoring, logging, and stress testing for a robust app.
Common Pitfalls to Avoid:
- Don’t skip logging non-error events; they’re key for auditing and analytics.
- Don’t rely on manual checks; automate monitoring and alerts.
- Don’t ignore stress testing; traffic spikes can happen anytime.
By mastering monitoring and logging, you’ll keep your blogging app fast, reliable, and user-friendly, no matter how many readers or admins it serves.
Slides
Imagine your blogging app hosts a viral post. Thousands of users flood in, and the app crashes. Without monitoring, you don’t know why, and without logs, you can’t fix it quickly. This lecture shows why these tools are critical for keeping your app reliable.
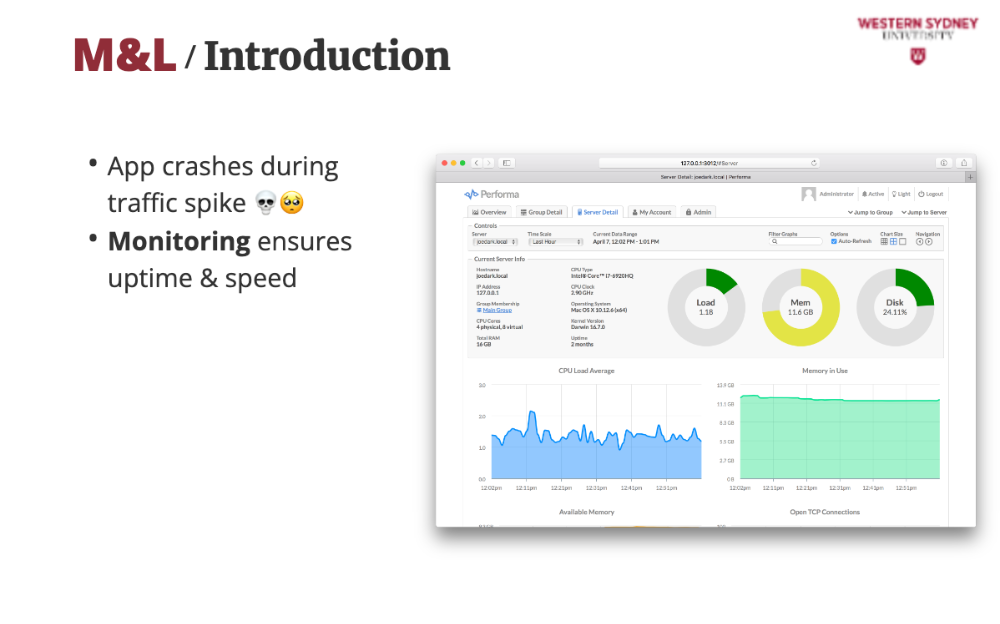
Monitoring tracks metrics like uptime and response times, acting like a dashboard to ensure your app is always available and fast for users browsing or filtering posts.
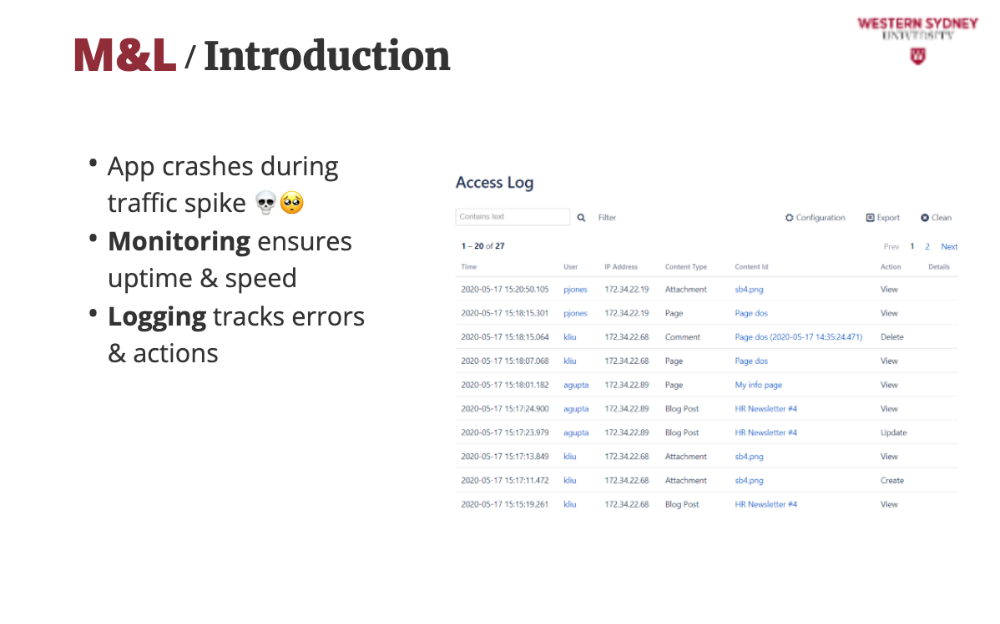
Logs record every event, like a user filtering posts by “tech” or an admin saving a draft, giving you a detailed history to debug issues or analyse user behaviour.
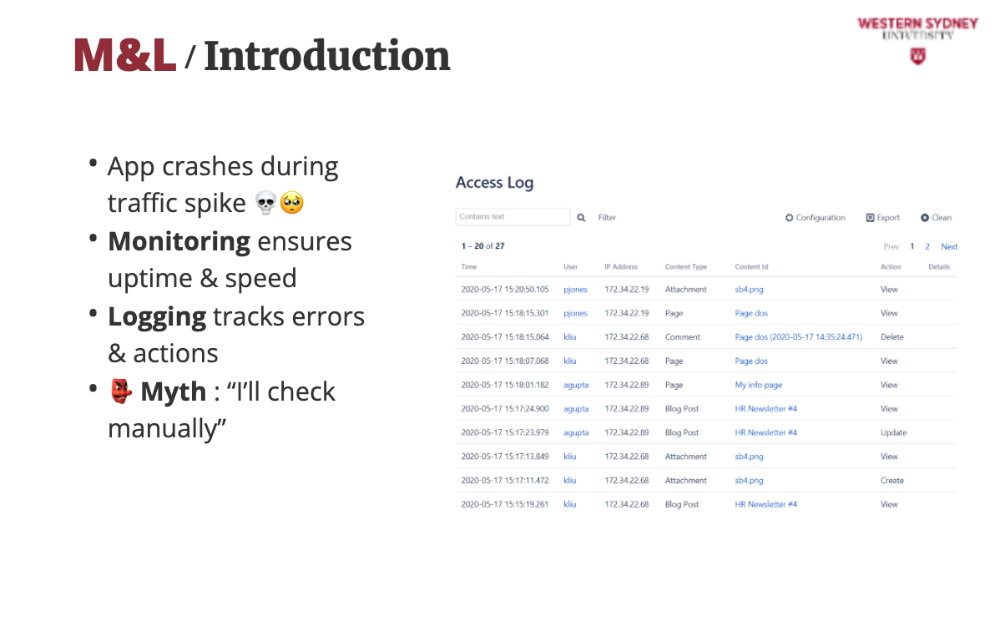
Many students think manual checks are enough, but with complex features like tag-based filtering or admin panels, only automated monitoring and logging can keep up with issues.
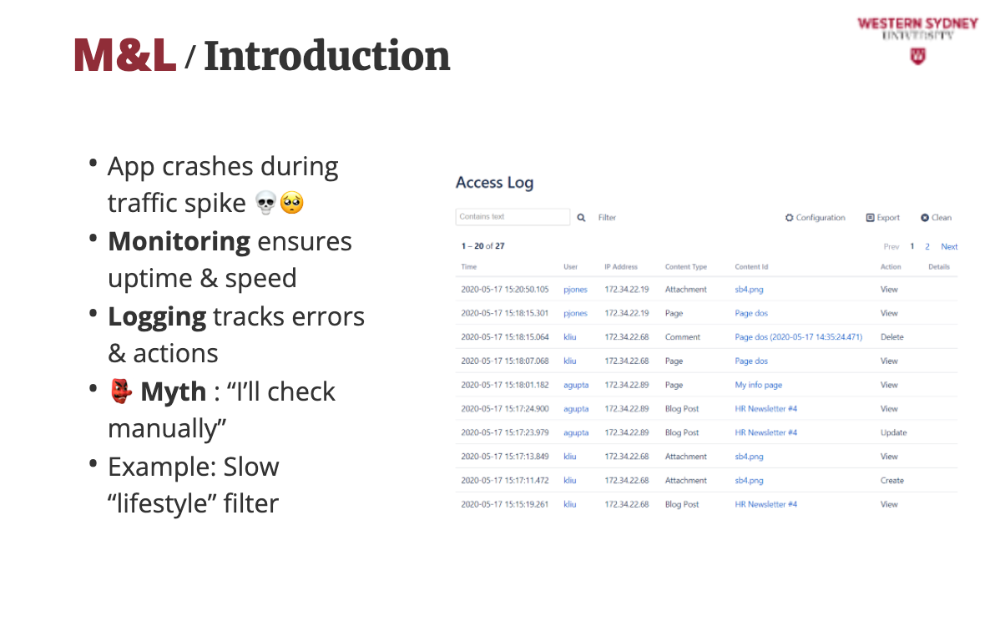
In our blogging app, monitoring shows a query for “lifestyle” posts take 5 seconds, and logs reveal it’s scanning too many records, guiding you to optimise the database for better performance.
Let's explore which are the primary use cases for monitoring and logging.
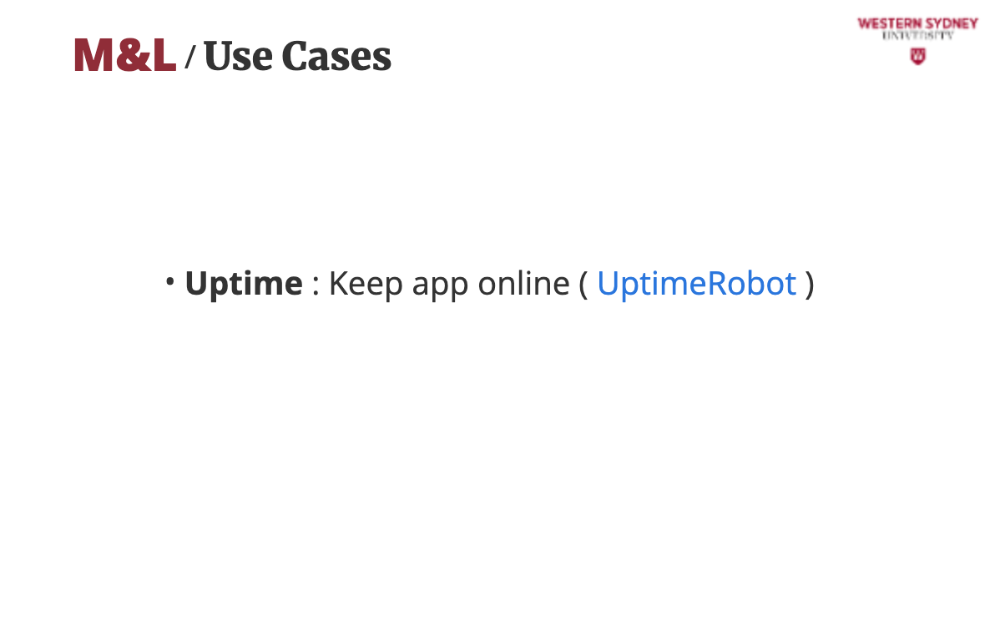
You should always make sure that your application is online. Monitoring tools like UptimeRobot check if your blogging app is reachable every minute, alerting you instantly if it goes down to ensure users can always access posts.
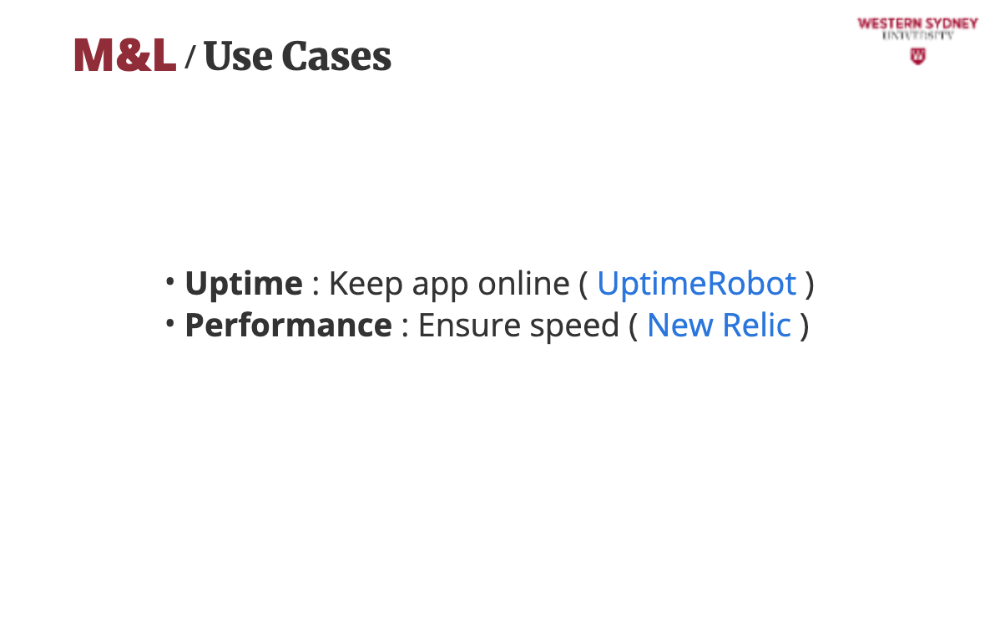
You also should know if and when your application struggles with performance. Tools like New Relic track response times and catch slow endpoints like filtering posts by tag, so you can optimise for a smooth user experience.
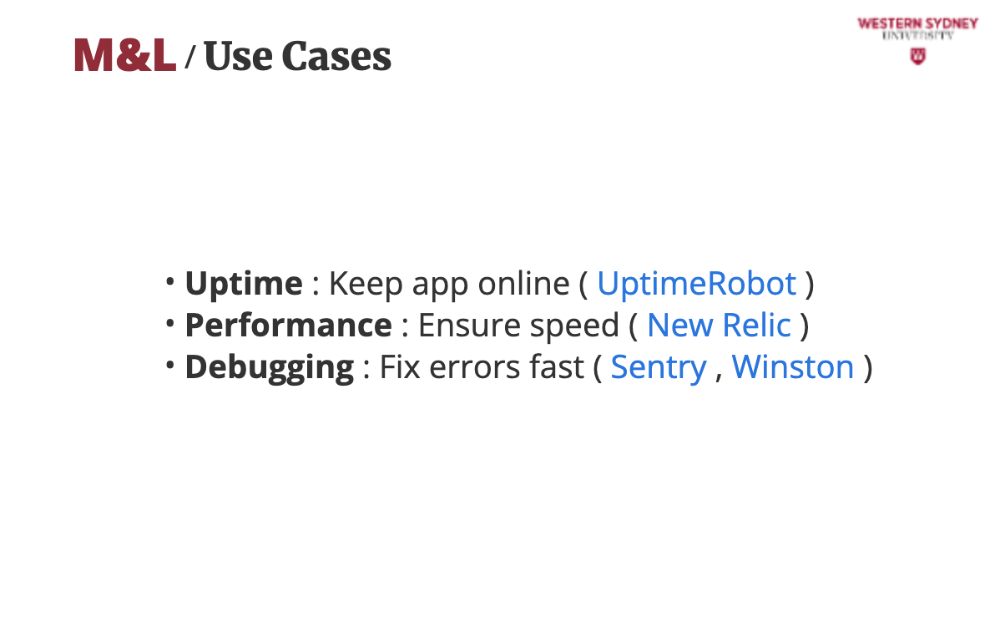
It is also impertinent when debugging your applications. Logs in tools like Sentry or Winston show why a post failed to save, like a missing title, allowing you to add validation and resolve issues quickly in the admin panel.
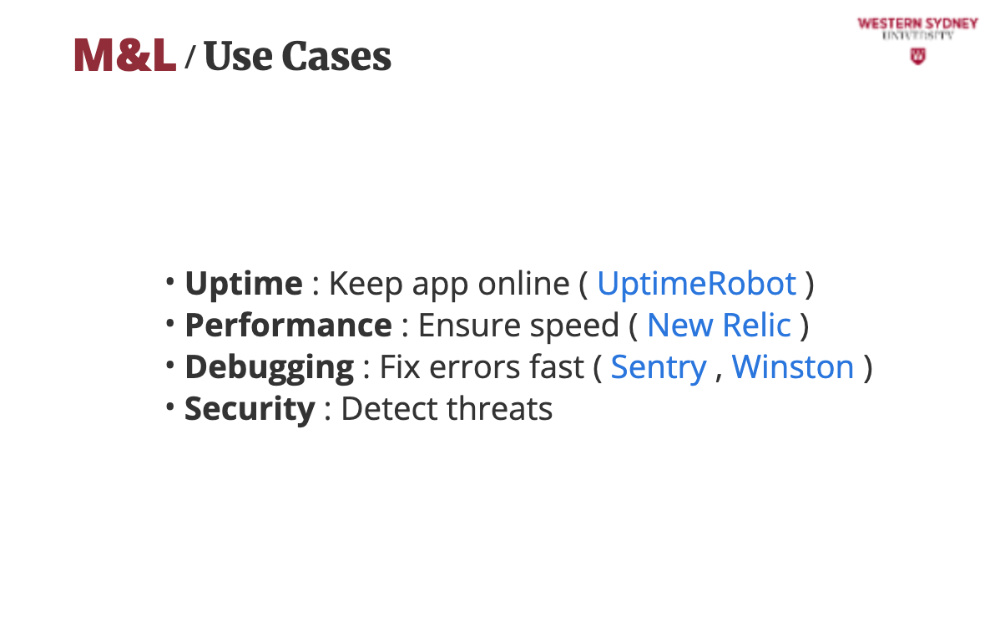
Considering the security of your apps, you can use logs to detect threats. Logs reveal suspicious activity, like repeated failed logins, and monitoring alerts you to block potential attacks on the admin panel, keeping your app secure.
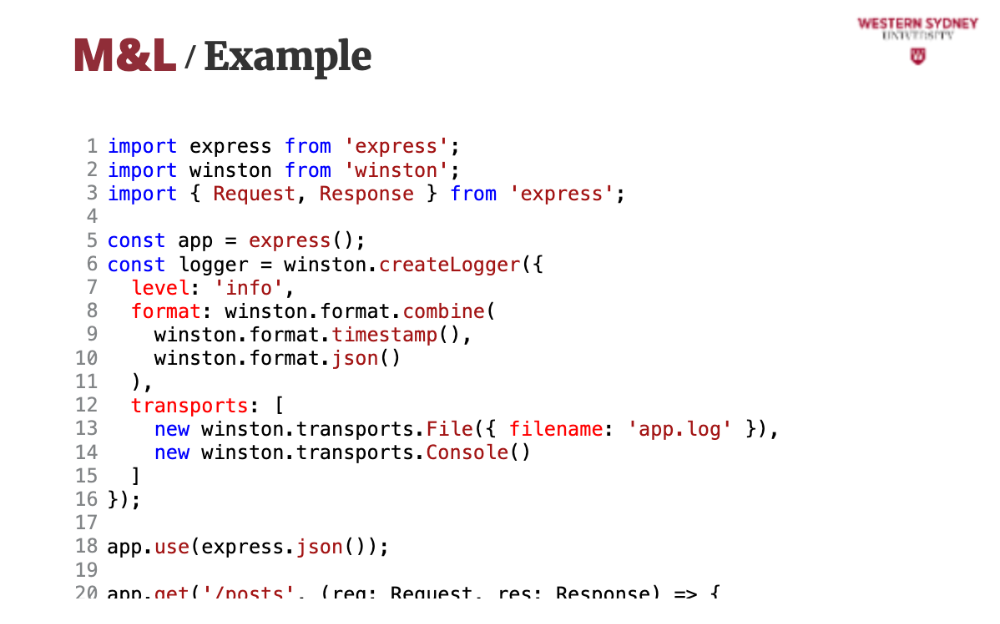
Let's check out an example. This code sets up logging for our blogging app using Winston. It logs user actions like filtering posts by tag and admin actions like saving posts, helping us track behaviour and debug errors, which are key use cases for logging.[
This is an expressJS application that uses Winston library to create logs.
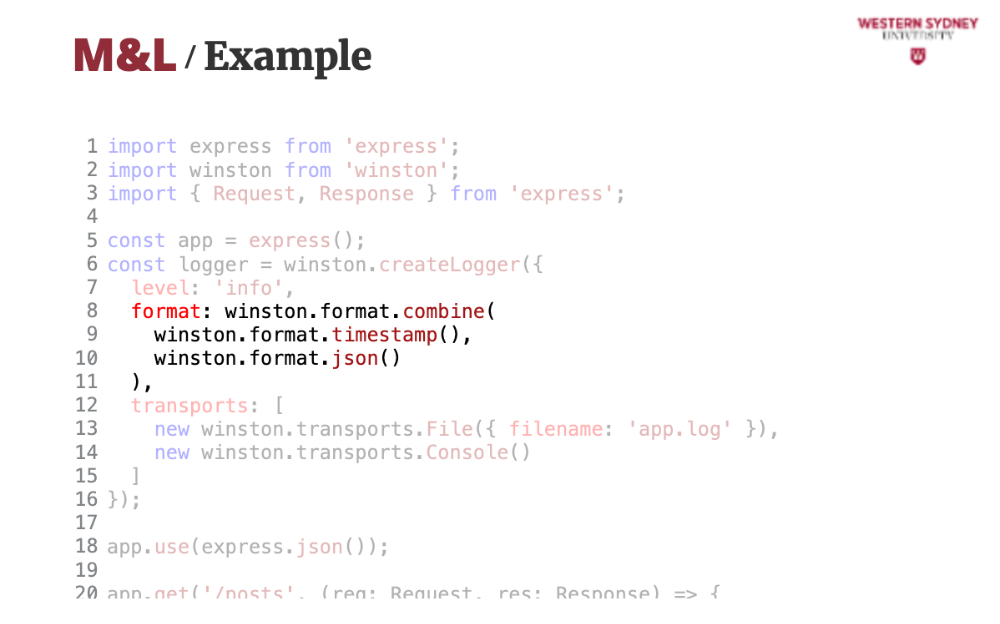
We configure Winston to log in JSON format with timestamps.
The logs are save to file and to console.
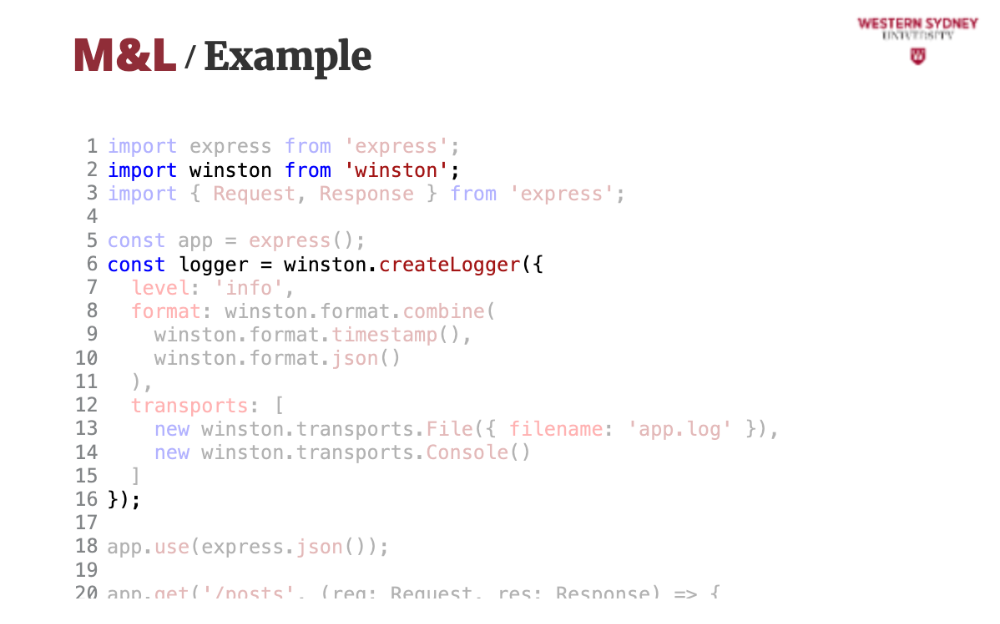
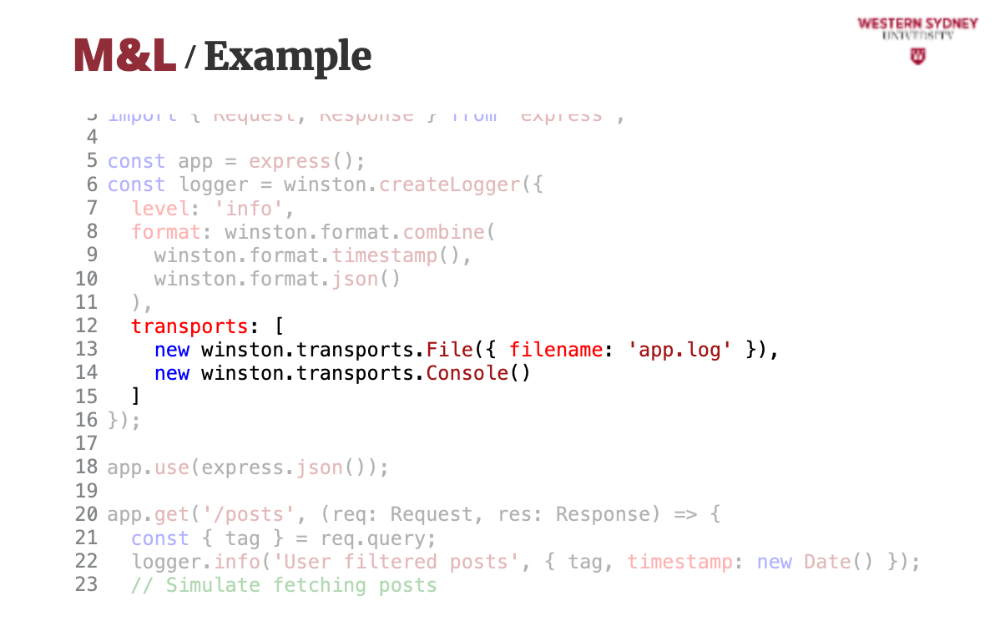
This is an example of how to use the logger. It logs when a user filters posts by tag, capturing the tag and timestamp, which helps analyse popular filters like “tech” or “lifestyle” in our blogging app.
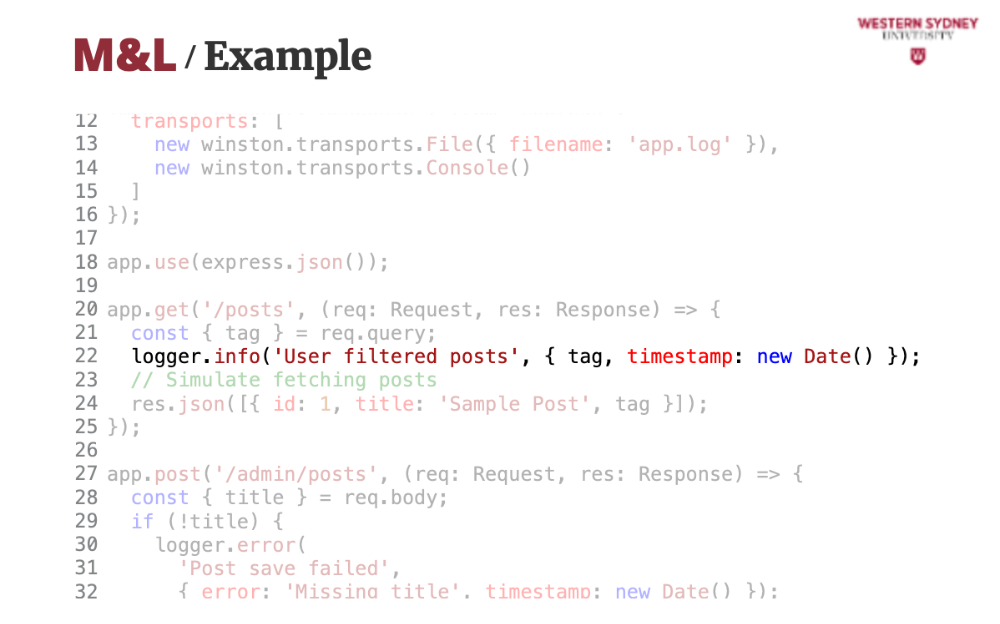
This line logs failed post saves in the admin panel, recording errors like missing titles to aid debugging, a critical use case for maintaining the admin panel.
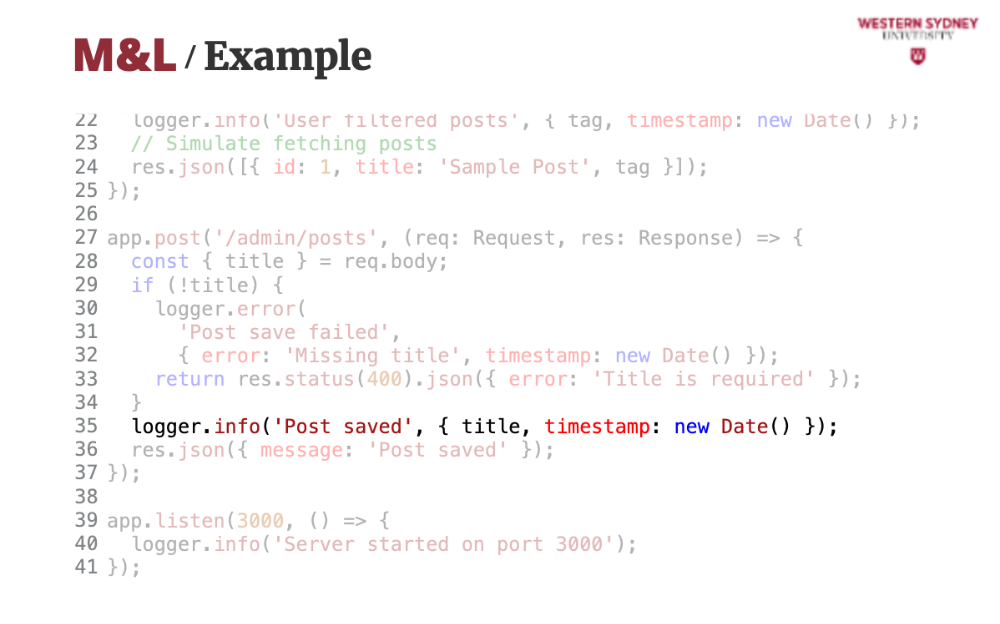
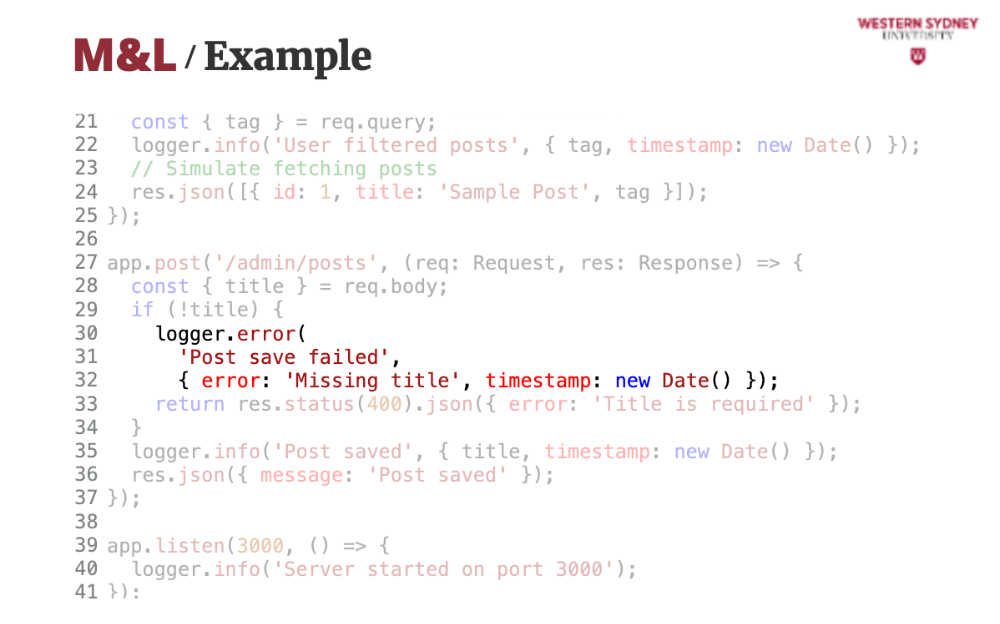
This line logs when the post saves successfully. That's it, simple and effective. you can configure Winston to save logs in a database or post them to an external service. Just make sure logging is not slowing down your app. It's best to keep it asynchronous.
Apart from monitoring and logging it is also important to know the limits of your app.
So, stress testing tools like Locust mimic thousands of users filtering posts to see if your blogging app can handle a traffic spike, ensuring uptime under pressure.
Tests reveal issues like slow database queries, allowing you to add indexes or caching to improve performance for users and admins.
For example, testing 10,000 users filtering by “lifestyle” shows a slow query. Logs and monitoring guide you to optimise it, ensuring the app stays reliable. In this case, caching fixes it, and the app handles 100,000 users and more!
Many tools can help. Locust simulates user traffic, JMeter tests specific endpoints like posts, and K6 offers modern scripting for stress testing your blogging app. You have many options and we hope you'll use them!

Let's wrap up!
Make sure to use tools like UptimeRobot and New Relic to ensure your blogging app is always online, fast, and error-free for users browsing or filtering posts.
Log all events, not just errors. Capture user actions, admin updates, and errors with tools like Sentry, Winston or Loggly to debug issues and understand behavior in your app.
Stress test for traffic spikes. Simulate heavy traffic with Locust or k6 to find and fix bottlenecks, ensuring your blogging app stays reliable during viral posts.
Please, don’t skip automation. Manual checks can’t handle complex apps with filtering or admin panels. Automate monitoring and logging to catch issues before users notice. That's it for this lecture. Go build!